
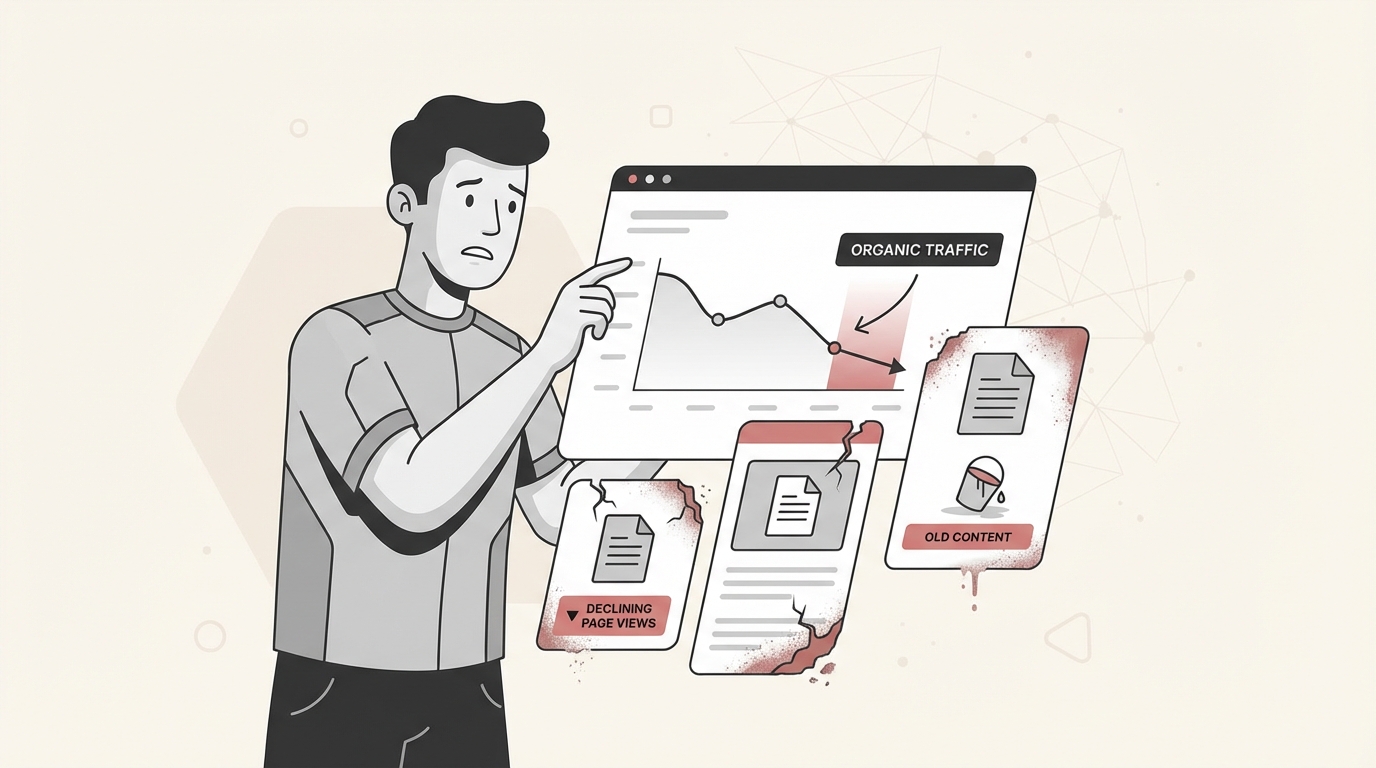
You have invested time and money into your website. You have created great content, optimized your keywords, and built quality backlinks. But your rankings are not where they should be. Your bounce rate is high. Visitors are leaving before they even see what you offer.
The culprit might be your Core Web Vitals. These three metrics (LCP, INP, and CLS) measure how real users experience your site. Google uses them as ranking factors. Poor scores do not just hurt your SEO. They frustrate your visitors and cost you conversions.
The good news? Most Core Web Vitals issues are fixable. This guide breaks down exactly how to improve Core Web Vitals with actionable strategies you can implement today.
What are Core Web Vitals and why do they matter?
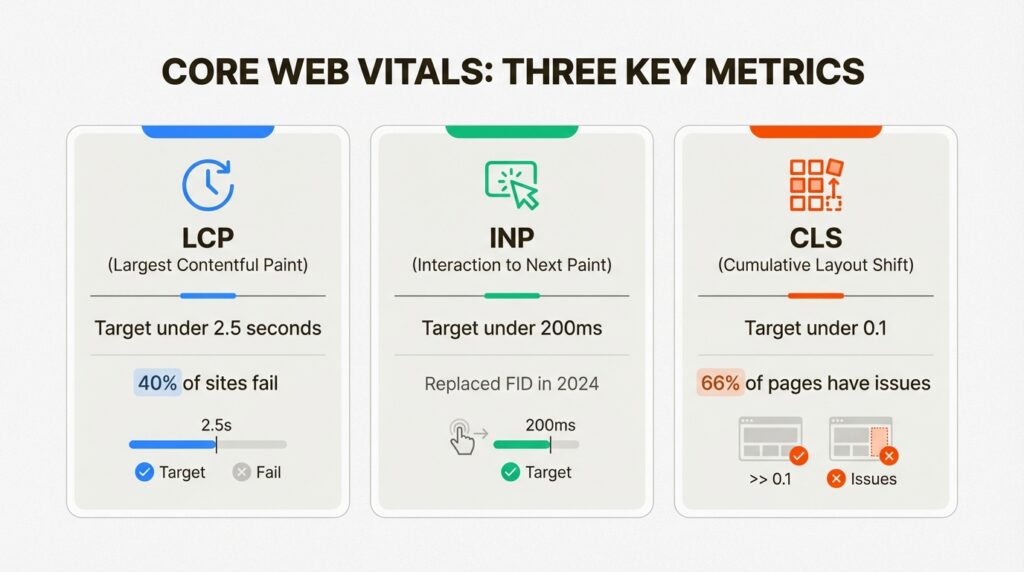
Core Web Vitals are a set of three metrics Google uses to measure user experience:
- Largest Contentful Paint (LCP) measures loading performance. It tracks how long it takes for the largest visible element (usually an image or text block) to render on screen.
- Interaction to Next Paint (INP) measures interactivity. It captures the longest delay between a user action (like a click) and the browser’s visual response.
- Cumulative Layout Shift (CLS) measures visual stability. It quantifies how much page elements unexpectedly move around during loading.
Here is why these metrics matter for your business. According to Google’s research, when a site meets the Core Web Vitals threshold, users are 24% less likely to abandon page load. That is nearly a quarter of your potential customers staying on your site instead of bouncing to a competitor.
The stakes got higher in 2024 when INP replaced FID (First Input Delay) as a Core Web Vital. INP is stricter. It measures the worst interaction during a user’s entire visit, not just the first one. Sites that passed FID are now failing INP.
Bottom line? Core Web Vitals are not optional. They directly impact your search rankings, user engagement, and revenue.
How to measure your current Core Web Vitals
Before you fix anything, you need to know where you stand. Here are the essential tools for measuring Core Web Vitals.
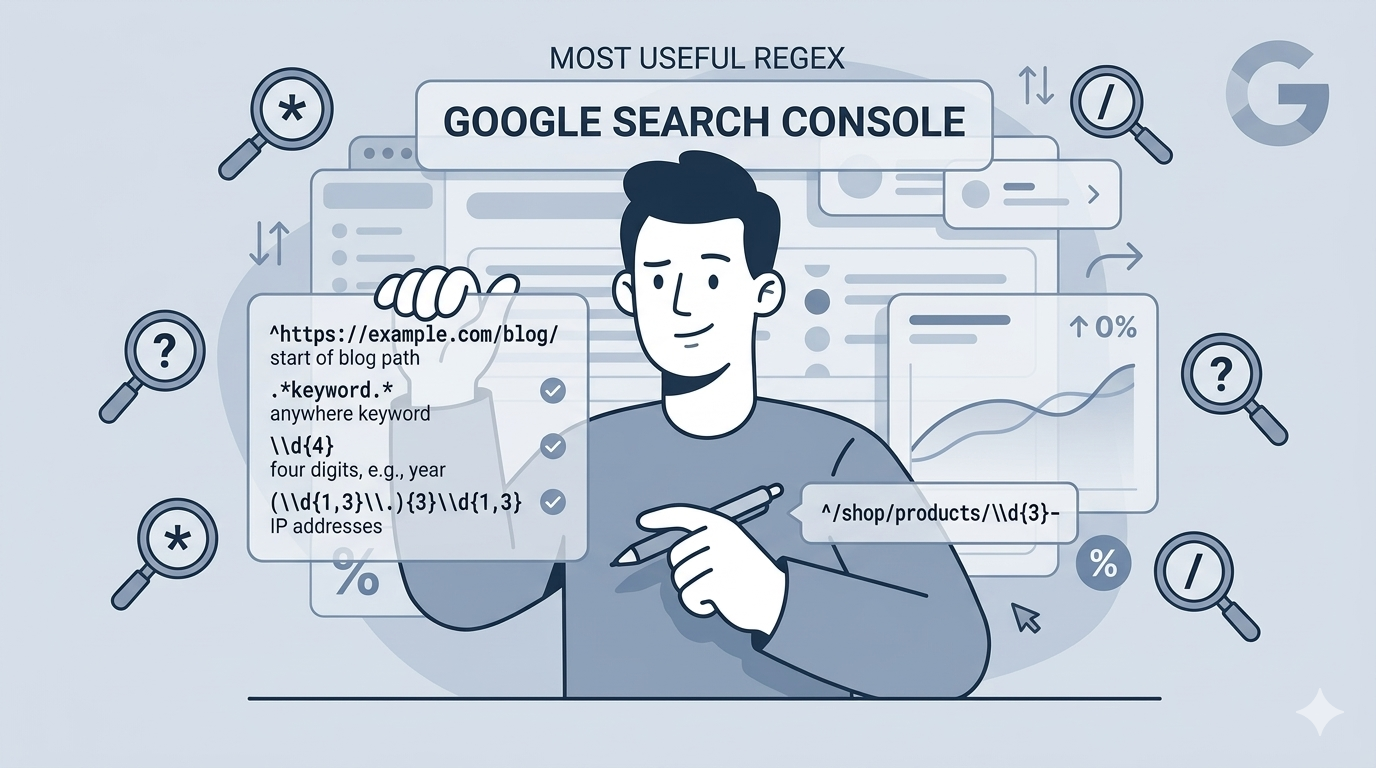
Google Search Console is your starting point for site-wide monitoring. The Core Web Vitals report shows how your pages perform based on real user data from the Chrome User Experience Report (CrUX). It groups URLs by status (Poor, Needs Improvement, Good) and identifies which metric needs attention.
PageSpeed Insights analyzes individual pages. It combines lab data (simulated tests) with field data (real user experiences). Enter any URL and get specific optimization recommendations.
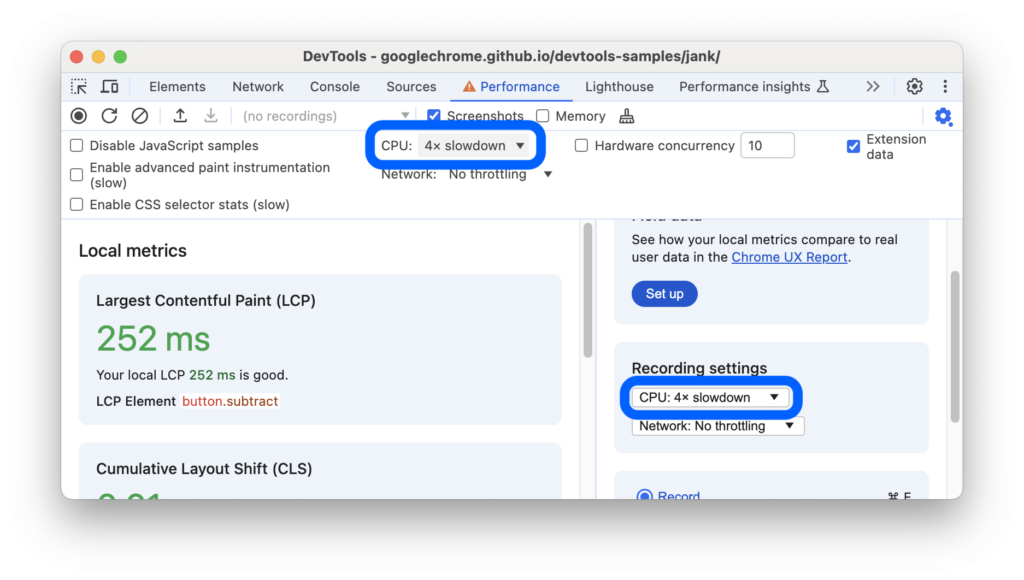
Chrome DevTools is for technical debugging. The Performance panel lets you record page loads and see exactly what is slowing things down. You can identify LCP elements, spot layout shifts, and analyze long tasks blocking the main thread.
Web Vitals Chrome extension gives you real-time feedback as you browse. It displays LCP, INP, and CLS metrics in your browser toolbar, making it easy to spot issues on any site.
Focus on field data (real user experiences) over lab data when available. Real users have varying devices, networks, and browsing conditions. Their experience matters more than a simulated test.
How to improve Largest Contentful Paint (LCP)
LCP measures how quickly your main content becomes visible. The target is under 2.5 seconds. According to the HTTP Archive, 73% of mobile pages have an image as their LCP element. Yet 40% of sites still fail to meet the LCP threshold.
Here is how to fix it.
Make your LCP image discoverable in the HTML source. The browser’s preload scanner needs to find your image immediately. Do not load it via JavaScript or hide it behind data-src attributes. Use a standard <img> tag with src or srcset in your initial HTML response.
Add fetchpriority="high" to your LCP image. This tells the browser to prioritize loading this resource over less critical assets.
<img src="hero-image.jpg" fetchpriority="high" alt="Hero image">Remove loading="lazy" from above-the-fold images. Lazy loading delays resource loading until the image is near the viewport. For your hero image, this adds unnecessary delay.
Use a Content Delivery Network (CDN). Only 33% of HTML document requests are served from CDNs. That means two-thirds of sites are missing an easy win. CDNs reduce Time to First Byte (TTFB) by serving content from servers geographically closer to your users.
Optimize and compress images. Convert images to WebP format. Serve responsive images with srcset so mobile devices do not download desktop-sized files. According to Fastly’s research, images make up 21% of average web page weight.
Enable browser caching. Static assets should cache at the browser level so repeat visitors load instantly.
One more statistic to consider: 35% of LCP images are not discoverable in the initial HTML response. If your LCP image loads via JavaScript or CSS background properties, you are likely in that 35%.
How to improve Interaction to Next Paint (INP)
INP measures responsiveness. It tracks the longest interaction during a user’s visit. The target is under 200 milliseconds. Anything over 500 milliseconds is considered poor.
INP replaced FID in 2024 because FID only measured the first interaction. INP captures the full experience. A site that responds quickly to the first click but lags on subsequent interactions will fail INP.
Here is how to improve it.
Break up long tasks. Any JavaScript task over 50 milliseconds blocks the main thread and delays user interactions. Use the scheduler.yield() API to pause execution and let the browser handle user input:
async function processData() {
  for (const item of largeDataset) {
    await scheduler.yield();
    processItem(item);
  }
}
Reduce your JavaScript payload. Remove unused code with tree shaking. Split your bundles so only critical code loads initially. Defer non-essential scripts until after the page is interactive.
Minimize DOM size. Keep your total DOM elements under 1,500. Deep DOM trees and excessive nesting slow down rendering and increase interaction delays.
Use CSS containment. The contain property isolates layout changes to specific elements, preventing them from triggering recalculations across the entire page.
Optimize event handlers. Avoid forced synchronous layouts (reading layout properties like offsetHeight immediately after writing to the DOM). Batch DOM reads and writes separately.
How to improve Cumulative Layout Shift (CLS)
CLS measures visual stability. It quantifies how much content unexpectedly shifts during page load. The target is under 0.1. A poor CLS score means users are accidentally clicking wrong buttons or losing their place while reading.
According to the Web Almanac, 66% of pages have at least one unsized image. That is two-thirds of the web causing unnecessary layout shifts.
Here is how to fix CLS issues.
Set explicit dimensions on images and videos. Always include width and height attributes. This lets the browser reserve space before the image loads.
<img src="photo.jpg" width="800" height="600" alt="Description">Use the CSS aspect-ratio property. For responsive containers where dimensions vary by screen size, aspect-ratio maintains the correct proportions:
.responsive-video {
  aspect-ratio: 16 / 9;
  width: 100%;
}
Reserve space for dynamic content. Ads, embeds, and iframes should have min-height values set. Even if you do not know the exact final height, a sensible minimum prevents dramatic layout shifts.
Avoid animating layout-inducing properties. Animating width, height, top, left, margin, or padding triggers layout recalculations and hurts CLS. Use transform properties instead:
/* Bad: causes layout shift */
.banner { transition: top 0.3s; }

/* Good: compositor-only animation */
.banner { transition: transform 0.3s; transform: translateY(-100%); }
Ensure pages are eligible for bfcache. The back/forward cache eliminates layout shifts when users navigate back to your page. Avoid unload event listeners and Cache-Control: no-store headers.
Load fonts properly. Use font-display: swap to prevent invisible text during font loading, or preload critical fonts to reduce Flash of Unstyled Text (FOUT).
Quick wins vs. long-term investments
Not all optimizations require the same effort. Here is how to prioritize your work.
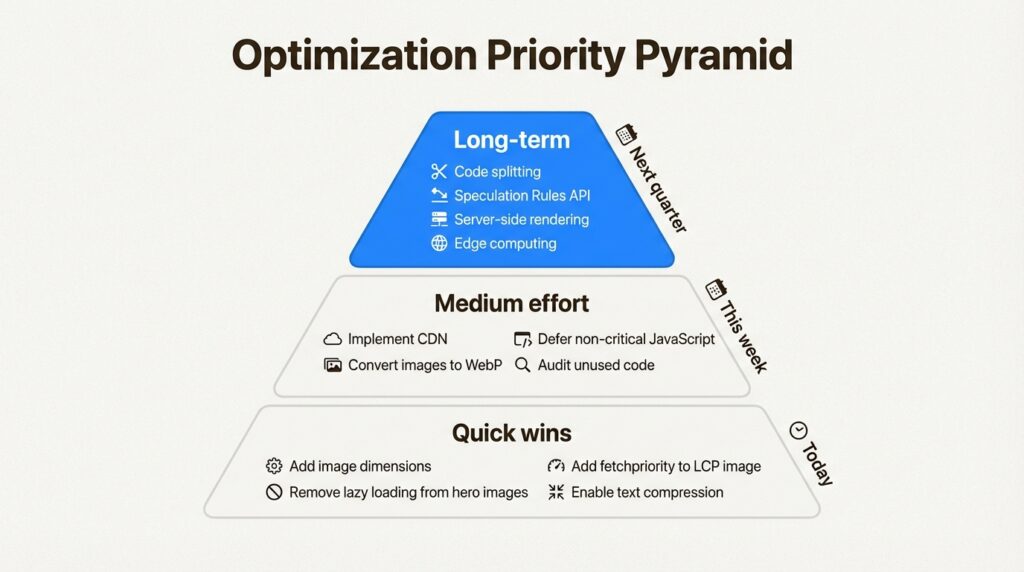
Quick wins (implement today):
- Add
widthandheightattributes to images - Remove
loading="lazy"from above-the-fold images - Add
fetchpriority="high"to your LCP image - Enable text compression (Gzip or Brotli) on your server
Medium effort (implement this week):
- Implement a CDN for static assets
- Convert images to WebP format with fallbacks
- Defer non-critical JavaScript
- Audit and remove unused CSS and JavaScript
Long-term investments (plan for next quarter):
- Implement code splitting and tree shaking
- Set up the Speculation Rules API for prerendering
- Migrate to server-side rendering or static site generation
- Configure edge computing for dynamic content
Start with the quick wins. They require minimal effort and deliver immediate improvements. Then tackle medium-effort items for bigger gains. Save long-term investments for when you have development resources available.
Common mistakes that hurt your Core Web Vitals
Knowing what not to do is just as important as knowing what to do. Here are the most common mistakes we see.
Loading hero images via JavaScript. Whether through lazy-loading libraries or dynamic imports, this delays LCP by hundreds of milliseconds. Your hero image should be in the initial HTML.
Using lazy loading on above-the-fold content. The loading="lazy" attribute is great for images below the fold. On hero images, it actively hurts performance.
Animating layout properties. Sliding banners that use top, left, or margin animations create layout shifts. Use transform: translate() instead.
Blocking the main thread with heavy JavaScript. Third-party scripts for analytics, chat widgets, and ads often monopolize the main thread. Audit what you actually need and defer the rest.
Not setting image dimensions. This is the easiest CLS fix, yet 66% of pages still get it wrong. Always set width and height.
Ignoring mobile performance. Google uses mobile-first indexing. If your mobile scores are poor, your desktop scores do not matter. Test on real mobile devices with throttled connections.
Start optimizing your Core Web Vitals today
Core Web Vitals are not just technical metrics. They represent real user experiences. Slow loading, unresponsive interactions, and shifting layouts frustrate visitors and cost you business.
The data is clear. Users are 24% less likely to abandon pages that meet Core Web Vitals thresholds. With 40% of sites failing LCP and 66% having CLS issues, there is a massive opportunity to outperform your competitors.
Here is your immediate action plan:
- Run your site through PageSpeed Insights right now
- Check the Core Web Vitals report in Google Search Console
- Implement the quick wins from this guide
- Schedule the medium-effort optimizations for this month
If you need help with complex optimizations (JavaScript refactoring, CDN configuration, or server-side rendering), our technical SEO services can accelerate your improvements. We specialize in helping businesses navigate the technical side of modern SEO and AI search optimization.
Small improvements compound. A faster LCP here, a reduced CLS there, and suddenly your site feels snappier. Users stay longer. Conversions increase. And Google rewards you with better rankings.
Start with one optimization today. Your users (and your bottom line) will thank you.
Frequently Asked Questions
What is the most effective way to improve Core Web Vitals on a WordPress site?
Start with image optimization. Use a plugin like WebP Express to serve modern image formats, add dimensions to all images, and remove lazy loading from hero images. Then implement a CDN (Cloudflare has a free tier) and audit your plugins. Deactivate any plugins loading JavaScript on pages where they are not needed.
How long does it take to see improvements in Core Web Vitals after making changes?
Google Search Console’s Core Web Vitals report uses a 28-day rolling window. You will see changes reflected in Search Console within a month. For immediate feedback, use PageSpeed Insights or Chrome DevTools to verify your fixes are working.
Do Core Web Vitals directly affect my Google search rankings?
Yes, but as part of a larger picture. Core Web Vitals are one of many ranking factors. Google has confirmed they are used as page experience signals. Poor scores will not automatically drop you to page ten, but they can be tiebreakers between similar content. More importantly, they directly impact user behavior metrics (bounce rate, time on site) that influence rankings.
What is the difference between lab data and field data for Core Web Vitals?
Lab data comes from simulated tests in controlled environments (like PageSpeed Insights simulations). Field data comes from real users browsing your site with the Chrome User Experience Report (CrUX). Field data matters more because it reflects actual user experiences across different devices, networks, and conditions. Google uses field data for ranking purposes.
Can I improve Core Web Vitals without a developer?
Some optimizations, yes. Adding image dimensions, enabling compression, and configuring a CDN often require no coding. However, JavaScript optimization, code splitting, and server-side rendering typically need developer expertise. Start with what you can do yourself, then bring in technical help for the complex items.
Why did my INP score get worse?
INP replaced FID as a Core Web Vital in March 2024. FID only measured the delay before the first interaction. INP measures the longest interaction throughout the entire user session. Many sites that passed FID now fail INP because they have slow interactions after the initial page load. Focus on breaking up long JavaScript tasks and reducing main thread blocking.


Leave a Reply